

Performance Watcher is never static. The platform evolves continuously: small improvements go live every week, often unnoticed on their own, but they steadily refine your analysis and benchmarking experience.
Once a month, we look back at the most significant changes. Here’s what’s new in Release 2026.8.0: a new quartile analysis, a complete analysis table, a redesigned Analysis page, clearer alerts, and two additions to Dashboards.
Stay tuned: more updates are on the way.
A new quartile analysis in Peer Analysis
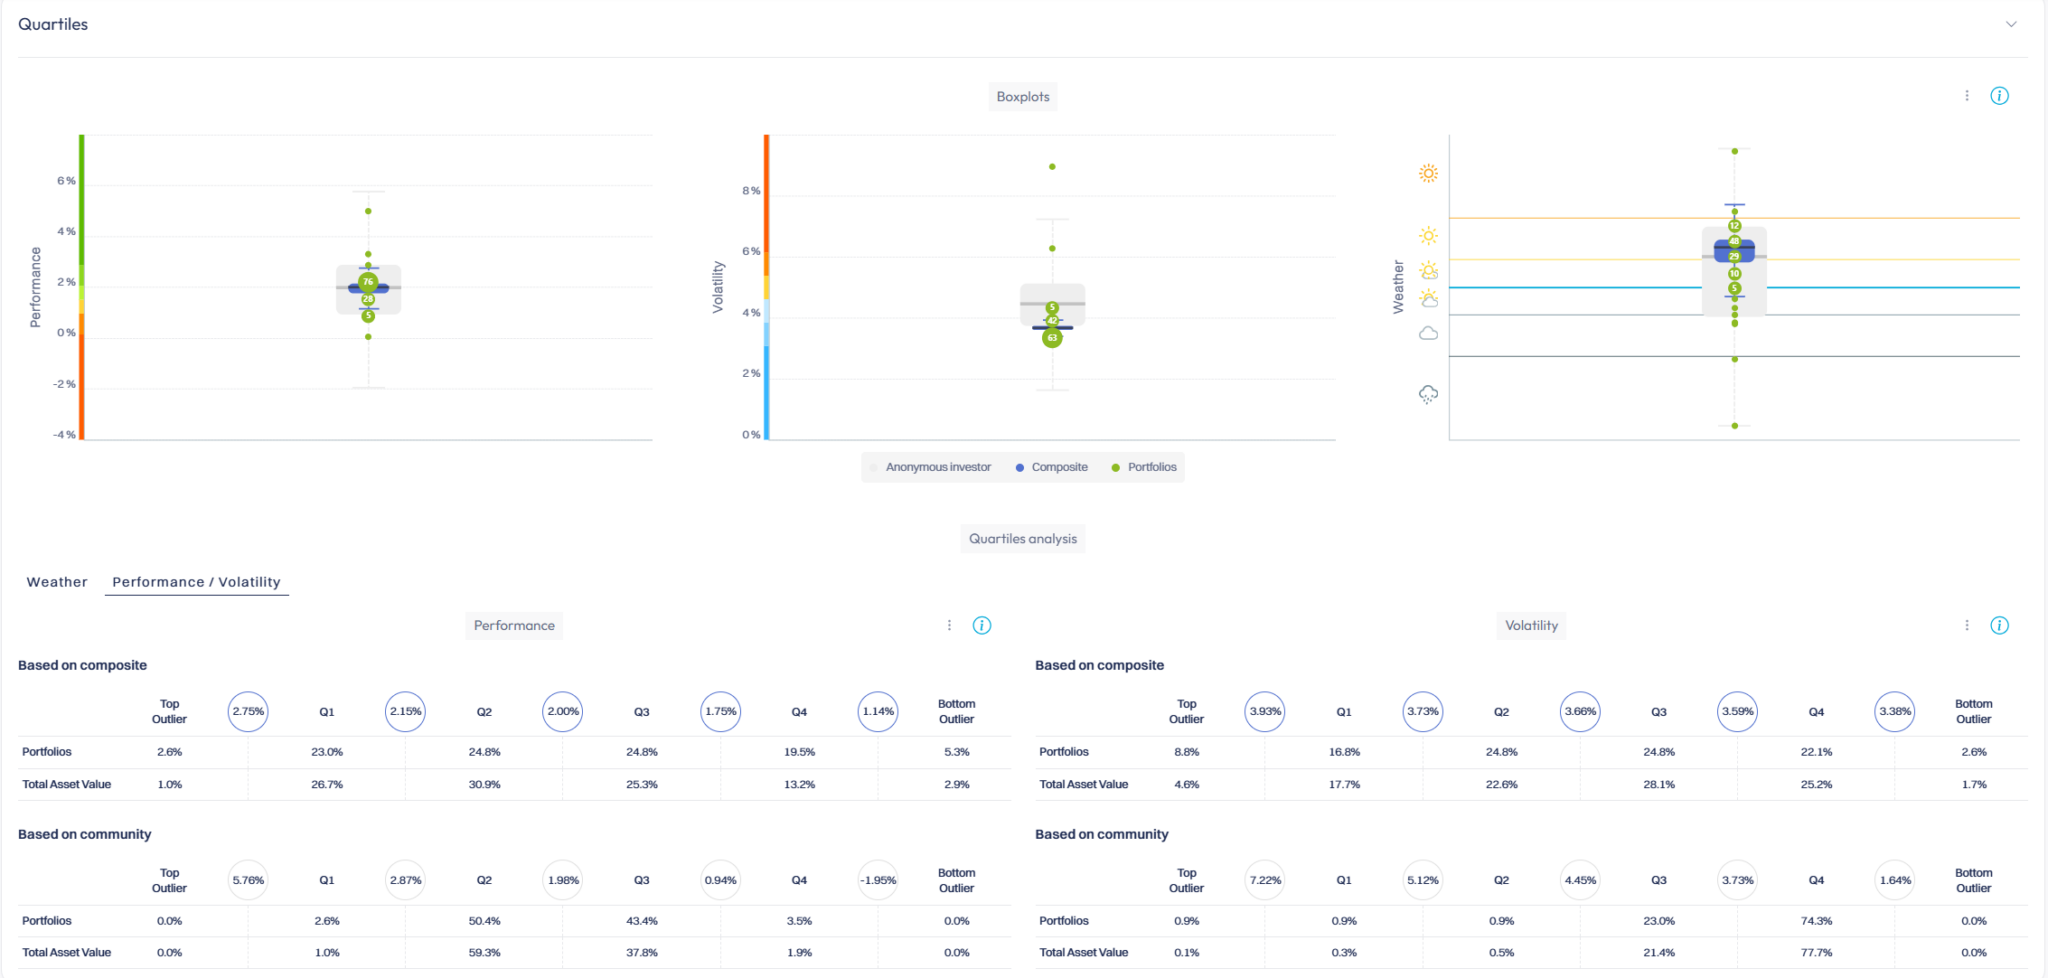
When you analyse a composite, the page now includes a new Quartile Analysis block, placed directly below the boxplots. For both the community and your composite, you can see:
- Quartile distribution (Top Outlier, Q1, Q2, Q3, Q4, Bottom Outlier), with the percentage of portfolios and assets in each band.
- Two views, Performance and Volatility, to place each portfolio precisely.
- A Weather view, which applies the same quartile distribution to performance weather.
A complete analysis table, on every analysis page
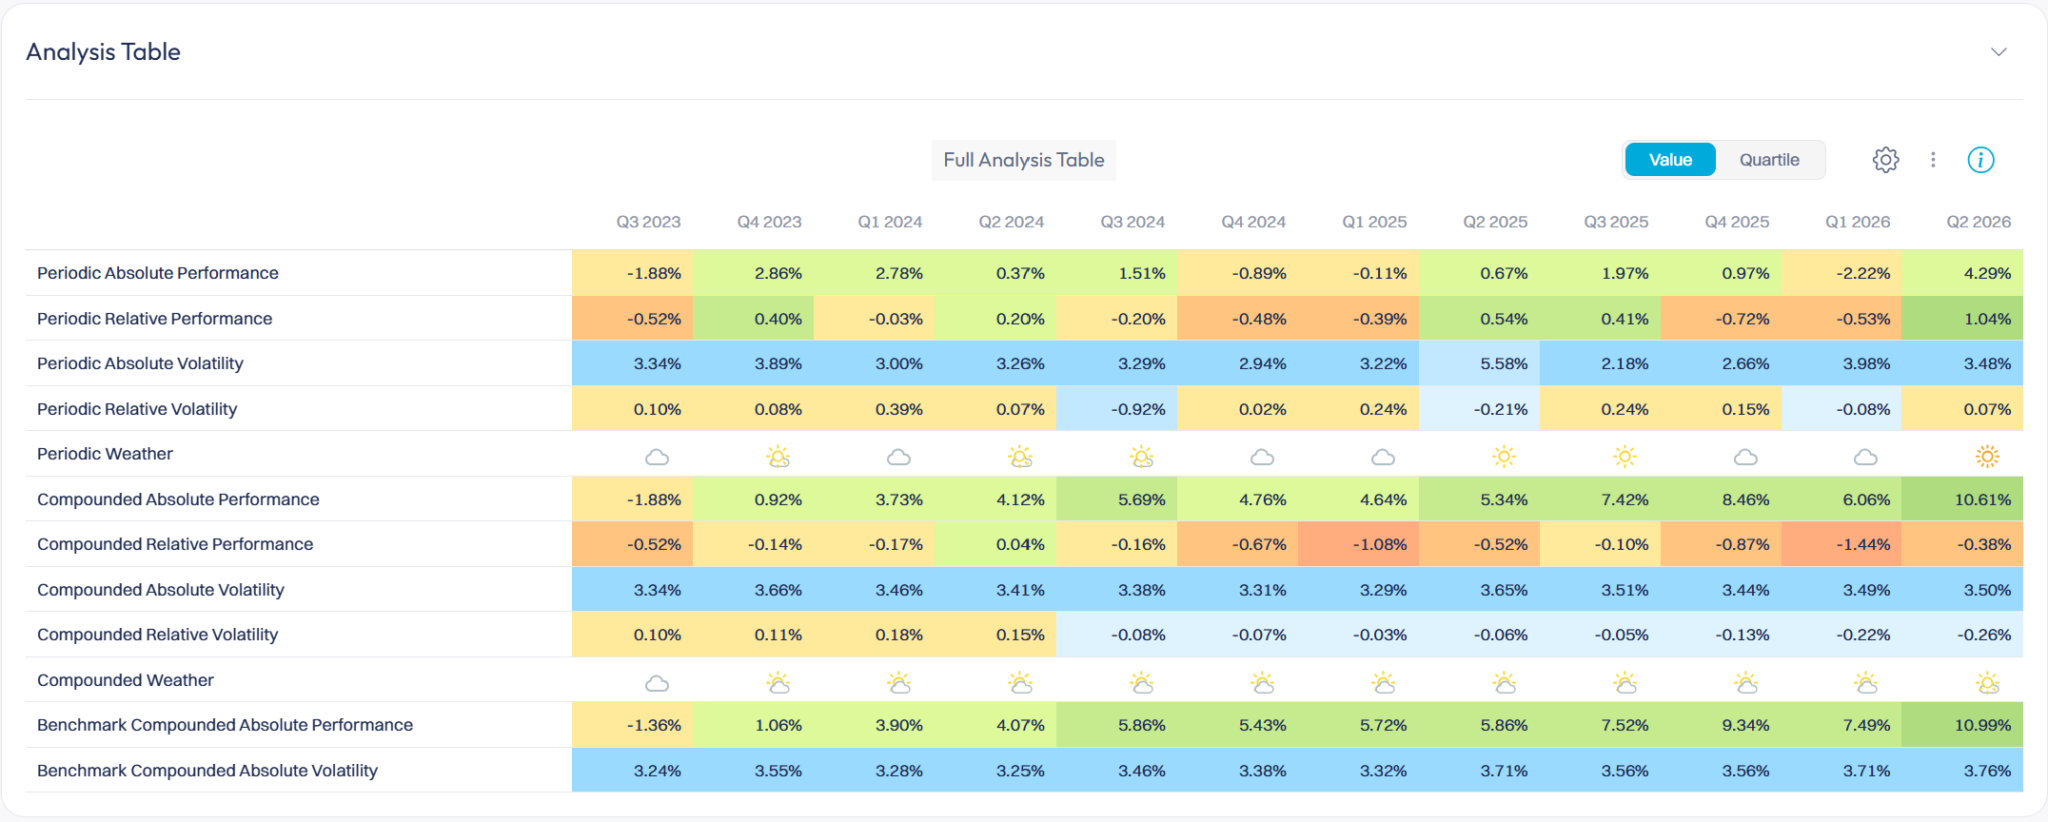
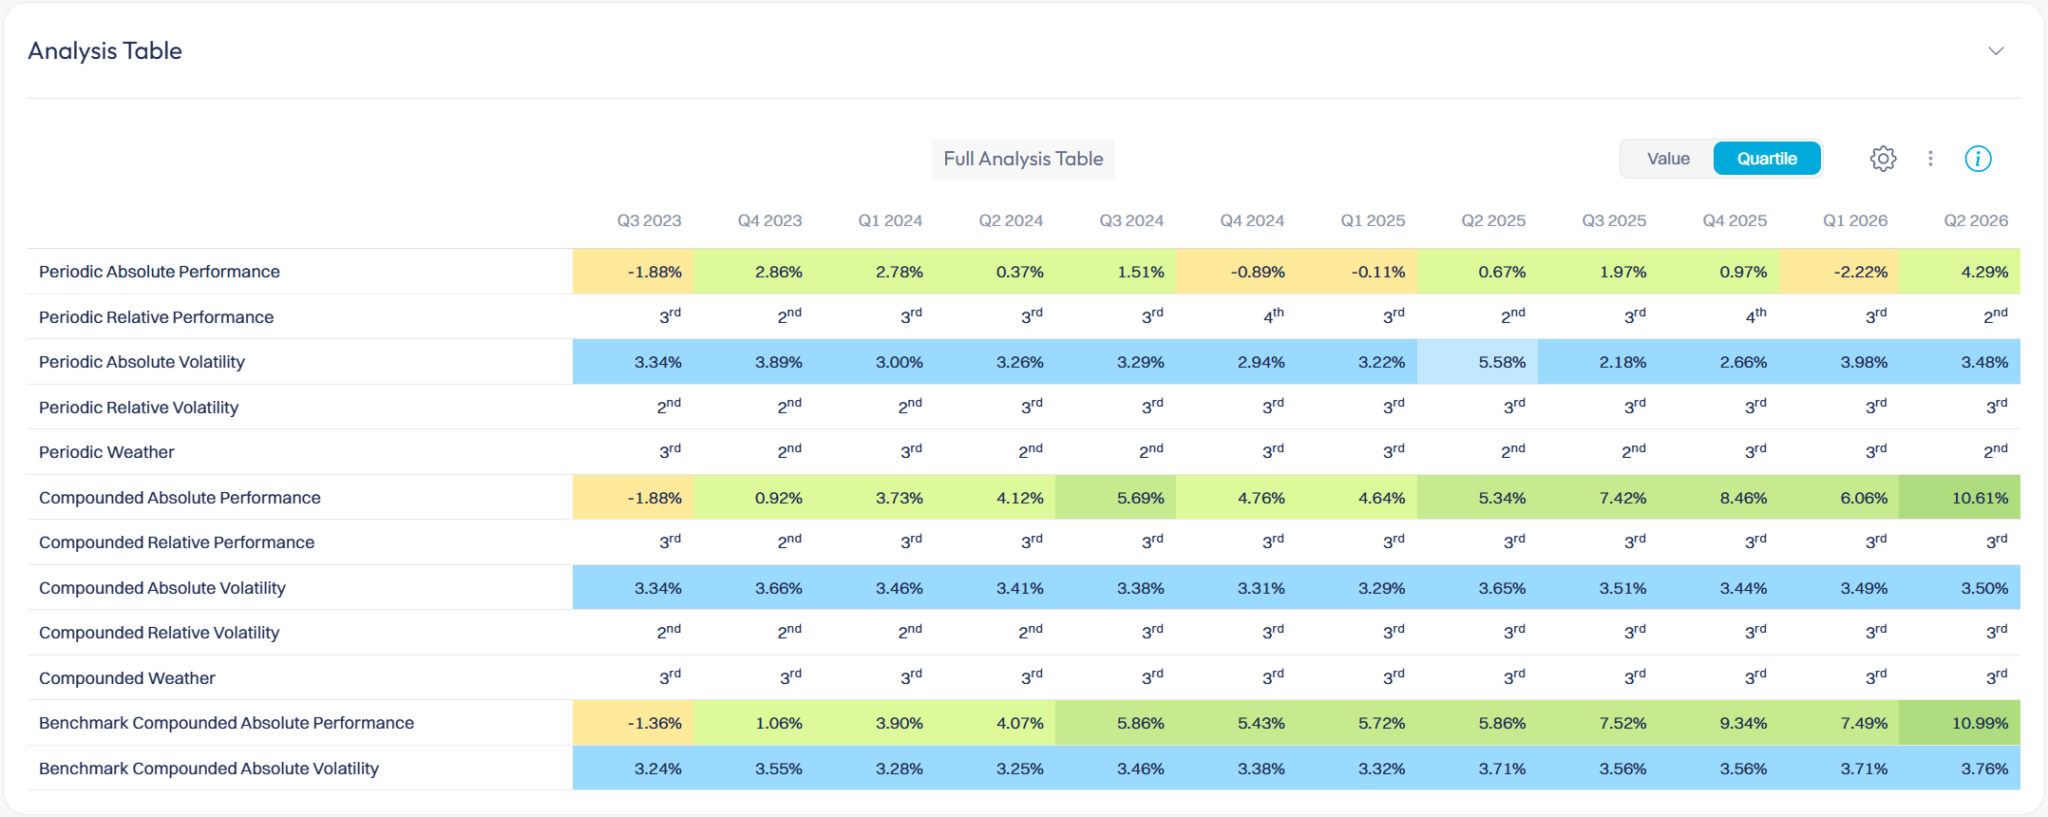
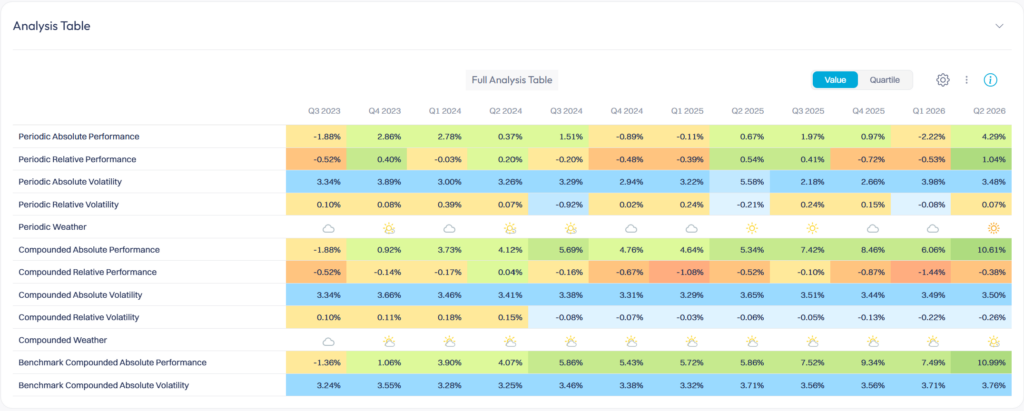
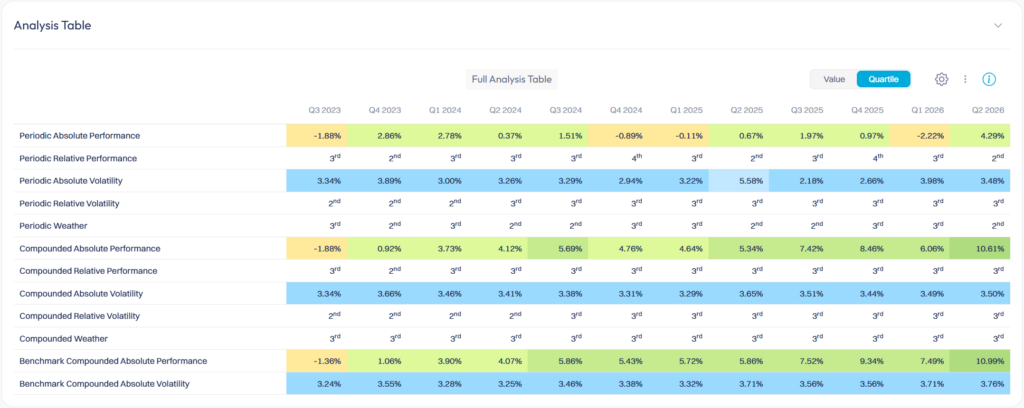
Every analysis page now includes an Analysis Table section, with a “Complete Analysis Table” block that brings together, at a glance:
- Absolute and relative performance and volatility, in periodic and cumulative view.
- The instrument’s periodic and cumulative weather.
- The reference index’s cumulative absolute performance and volatility.
- A Value / Quartile toggle, to read either raw figures or each row’s quartile position.
A clearer Analysis page
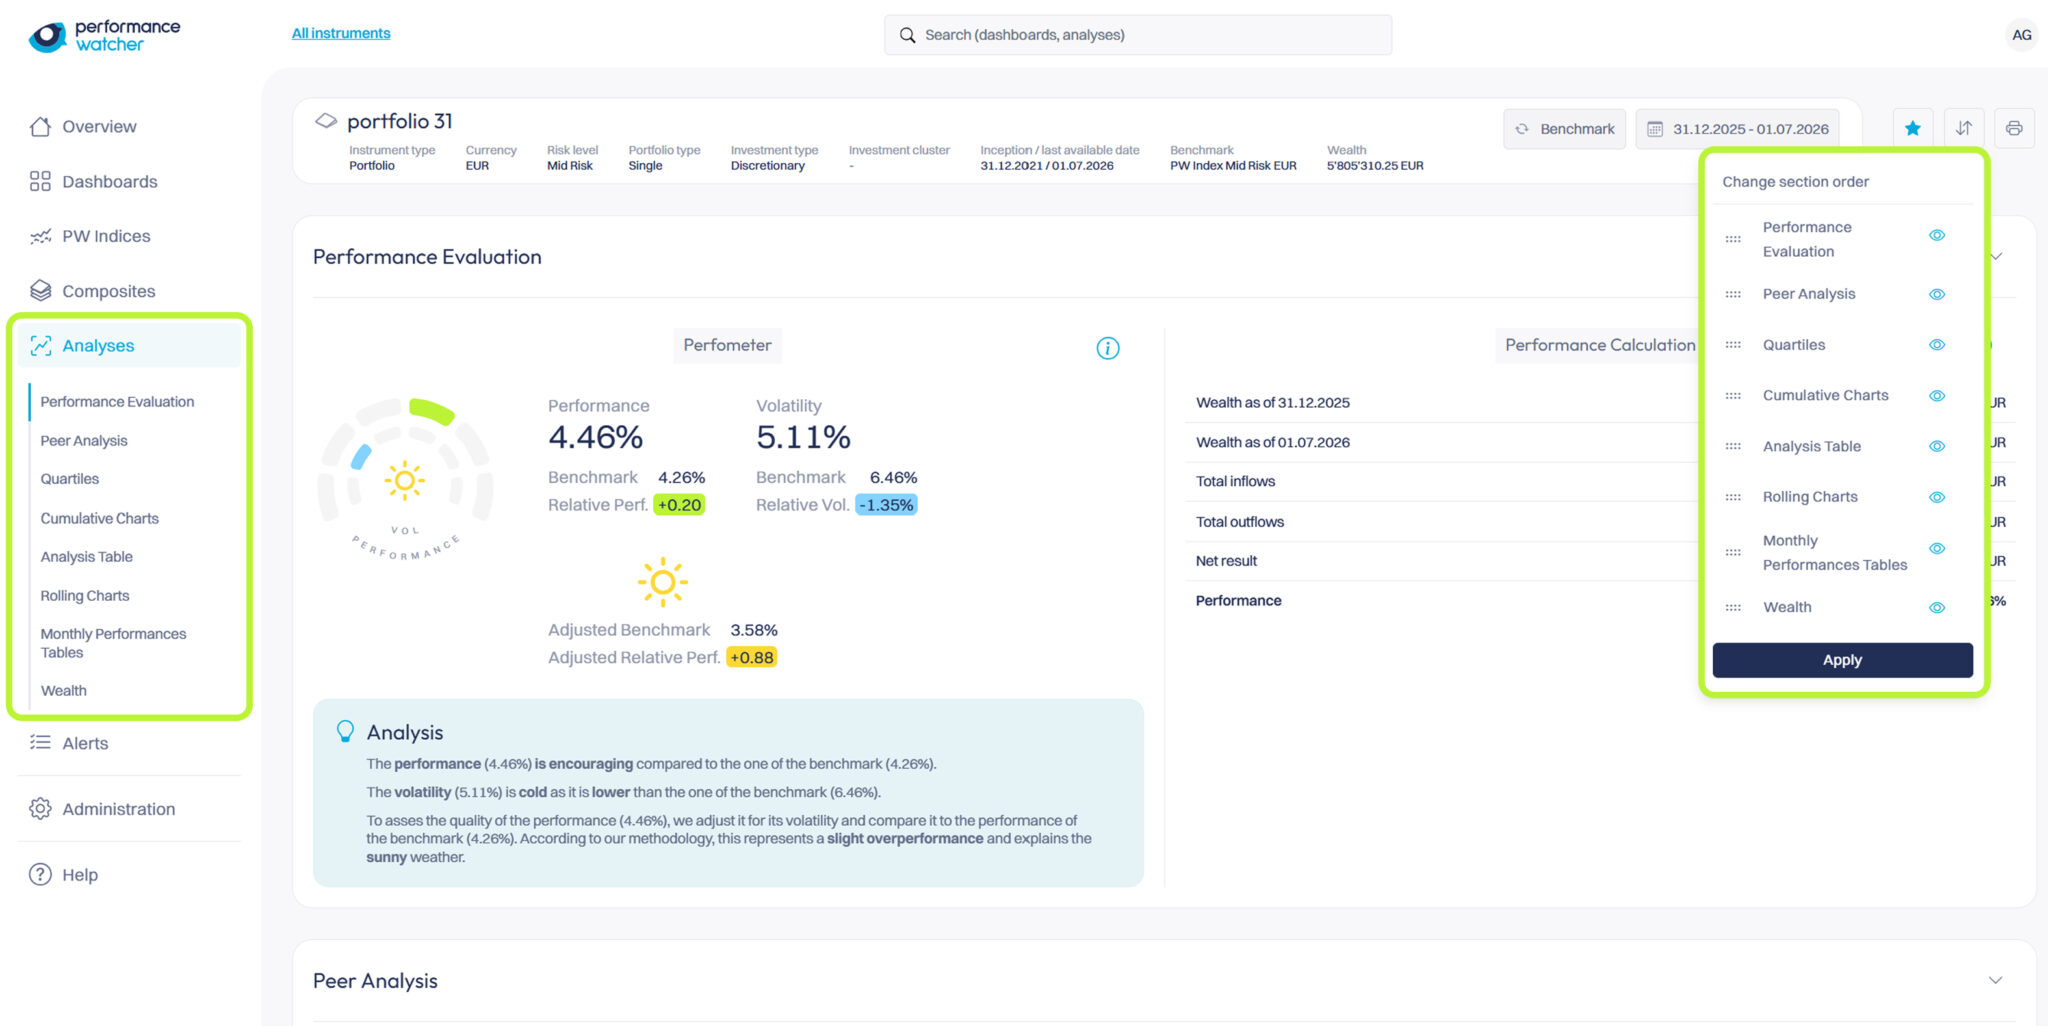
We reworked the overall Analysis page experience, across all instruments:
- Built-in glossary: a side menu appears once an instrument is selected, listing every section of the analysis. One click scrolls straight to the relevant content.
- Sections you can show or hide, so only what matters stays on screen, with the option to print a custom report that matches the analysis page.
Alerts that are easier to track
Two improvements to alert notification management:
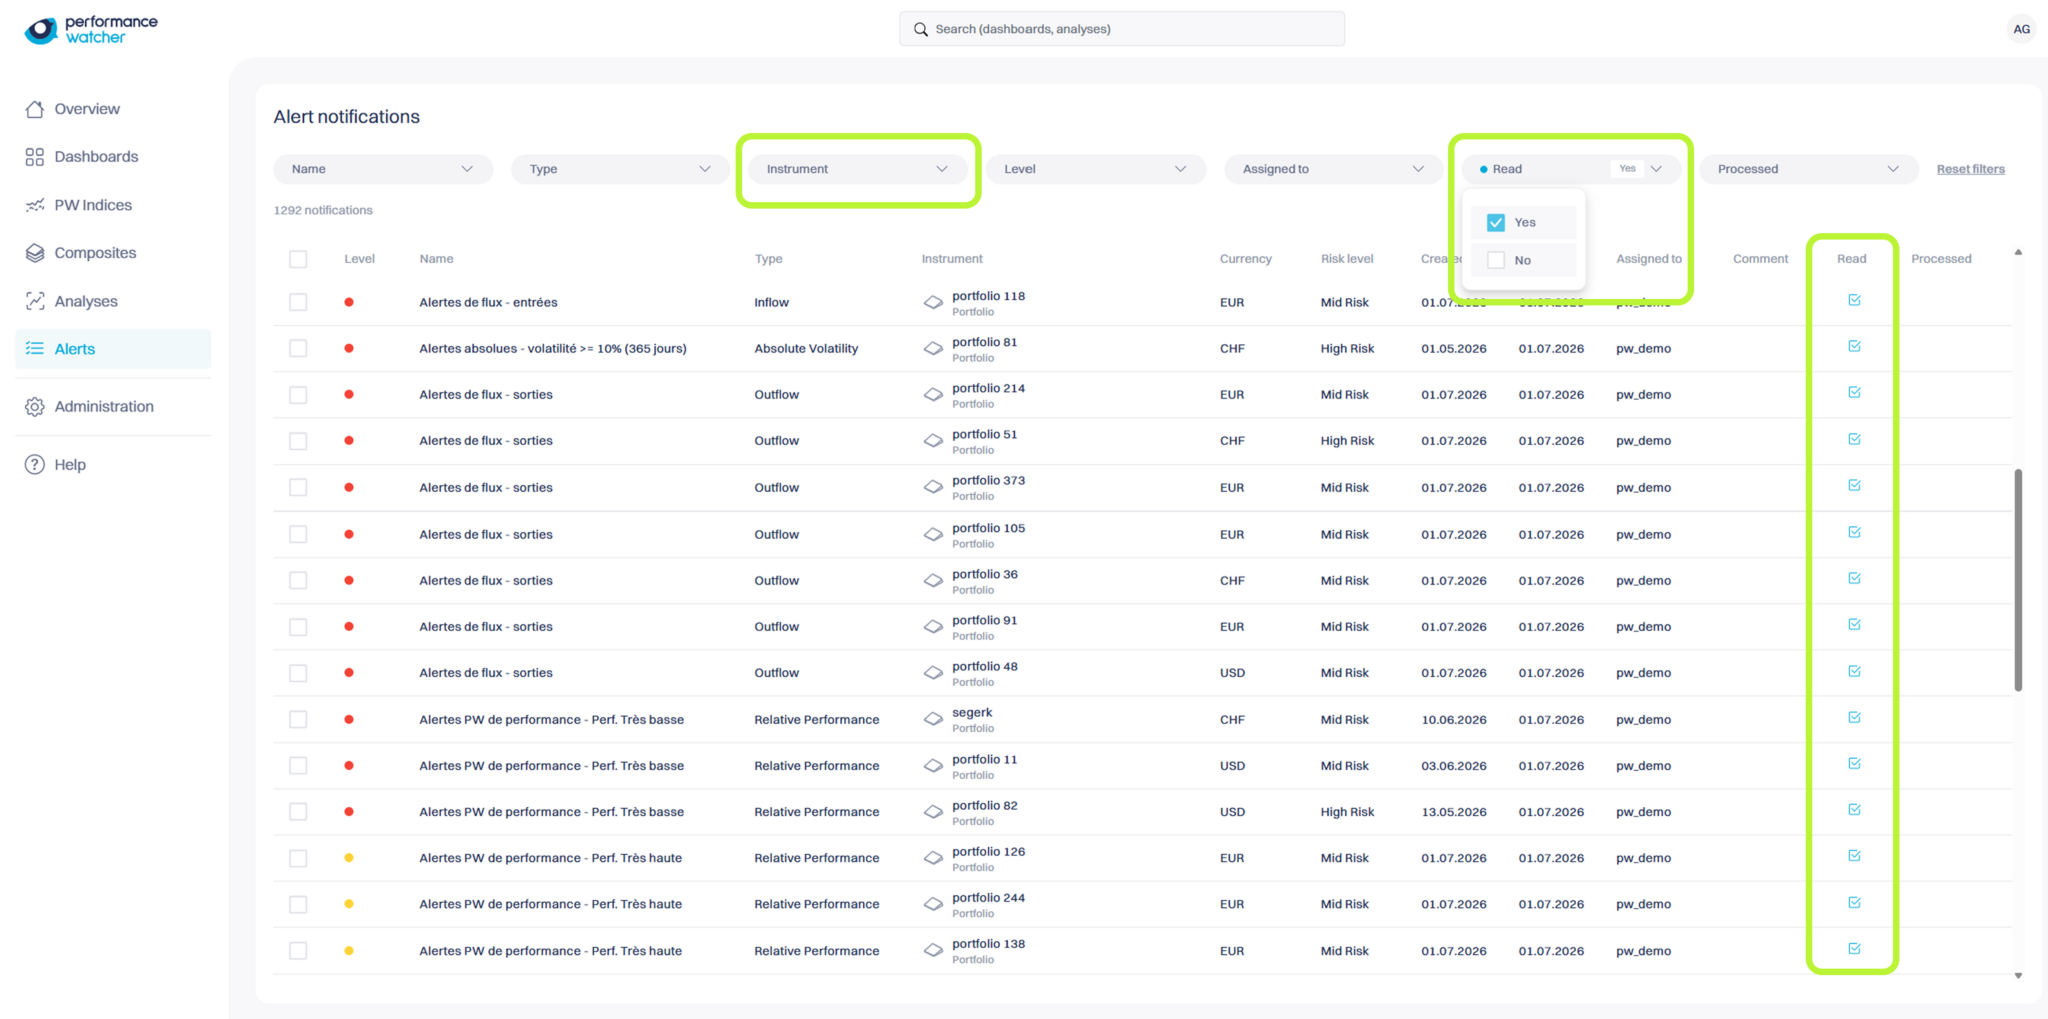
- A Read / Unread column, alongside the existing Processed / Not Processed status. It distinguishes an alert you have already seen from one that is genuinely resolved, useful when an underlying issue persists and regenerates a notification the next day.
- A search filter by instrument, to find notifications tied to a specific portfolio in an instant.
Quartiles now in your Dashboards
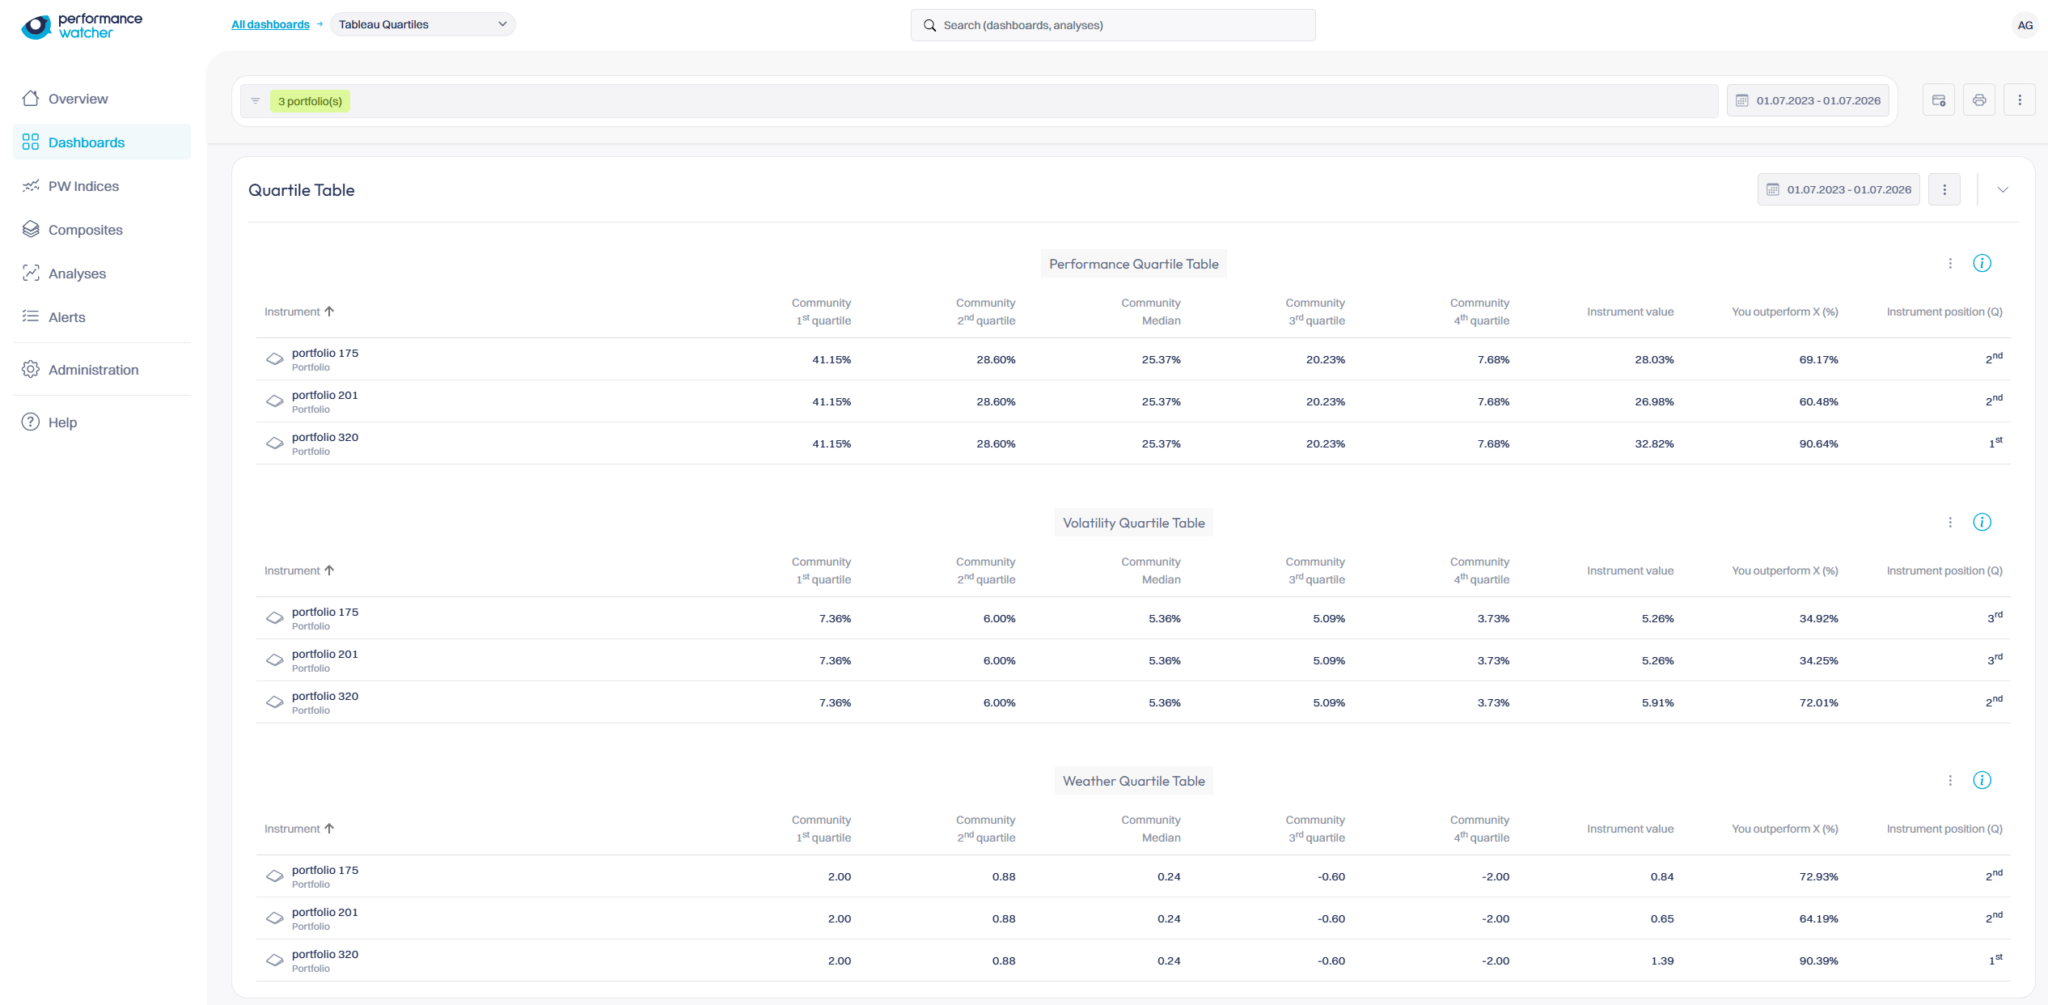
Three new widgets are available for building dashboards:
- Performance Quartile Table
- Volatility Quartile Table
- Weather Quartile Table
Each one shows where your instruments stand against the community, from the 1st to the 4th quartile, median included, along with the percentage of portfolios outperformed.
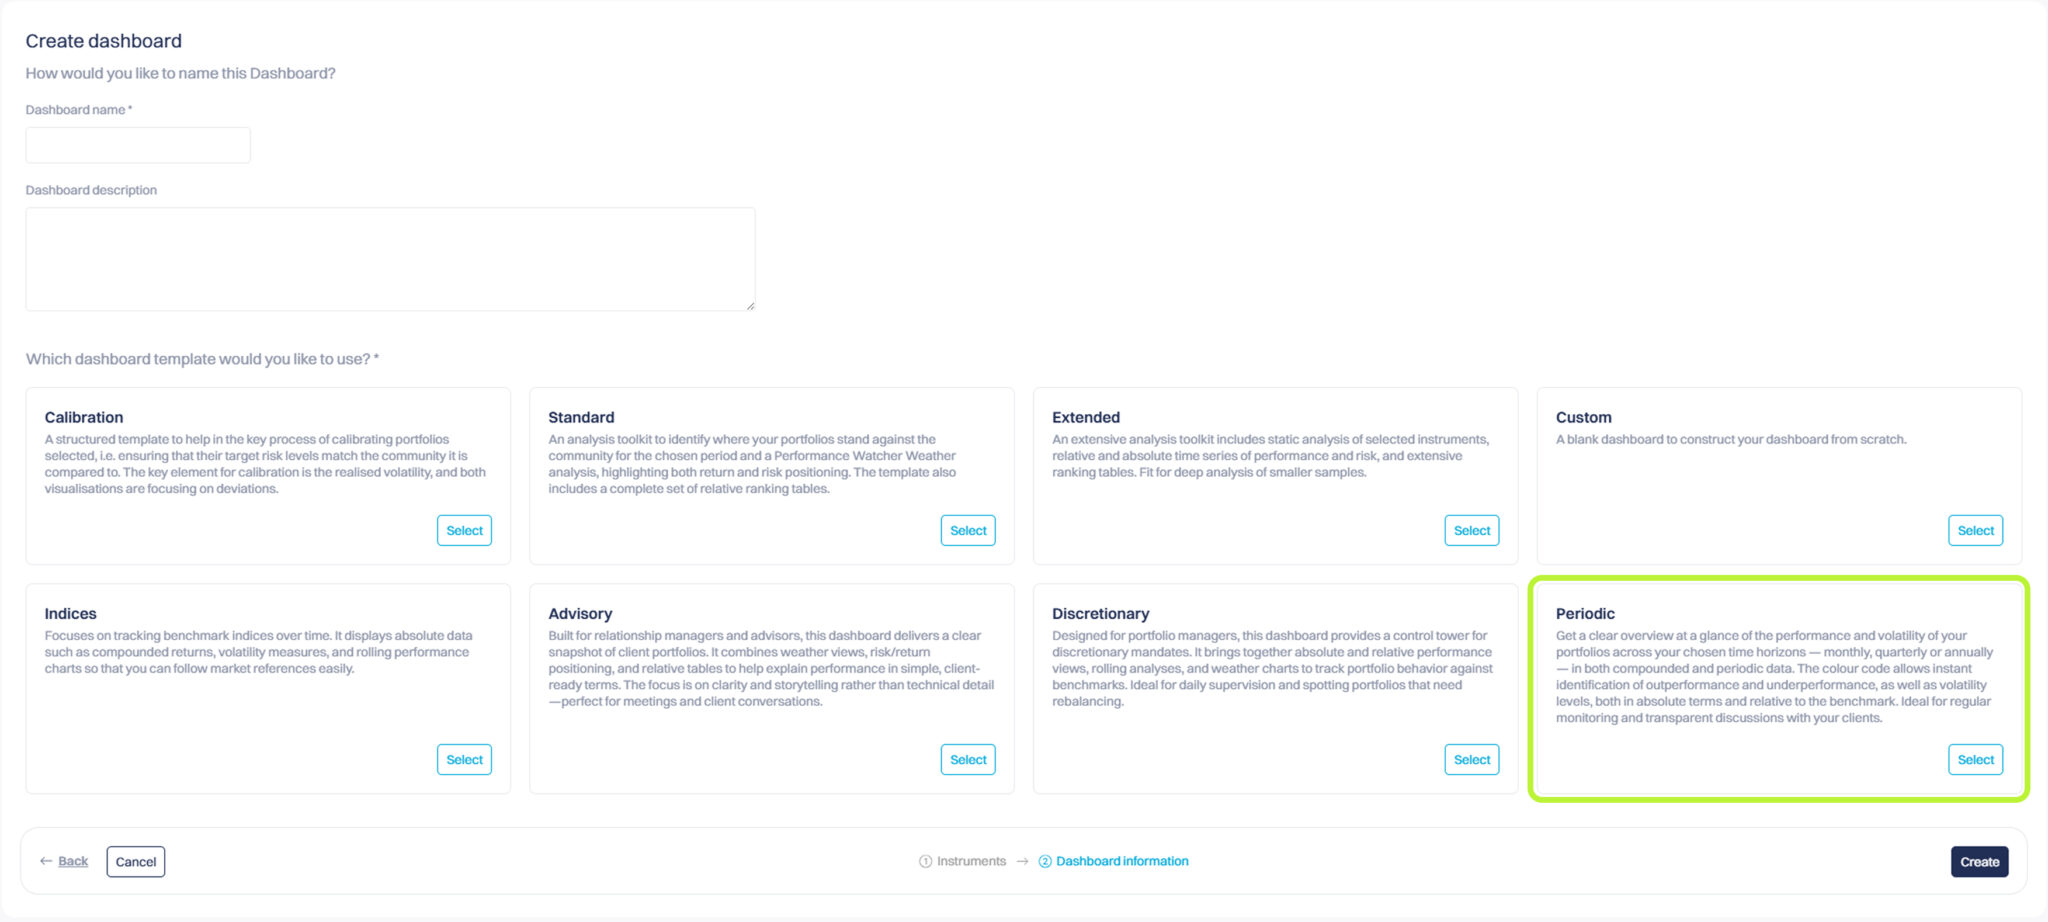
A new dashboard template: Periodic
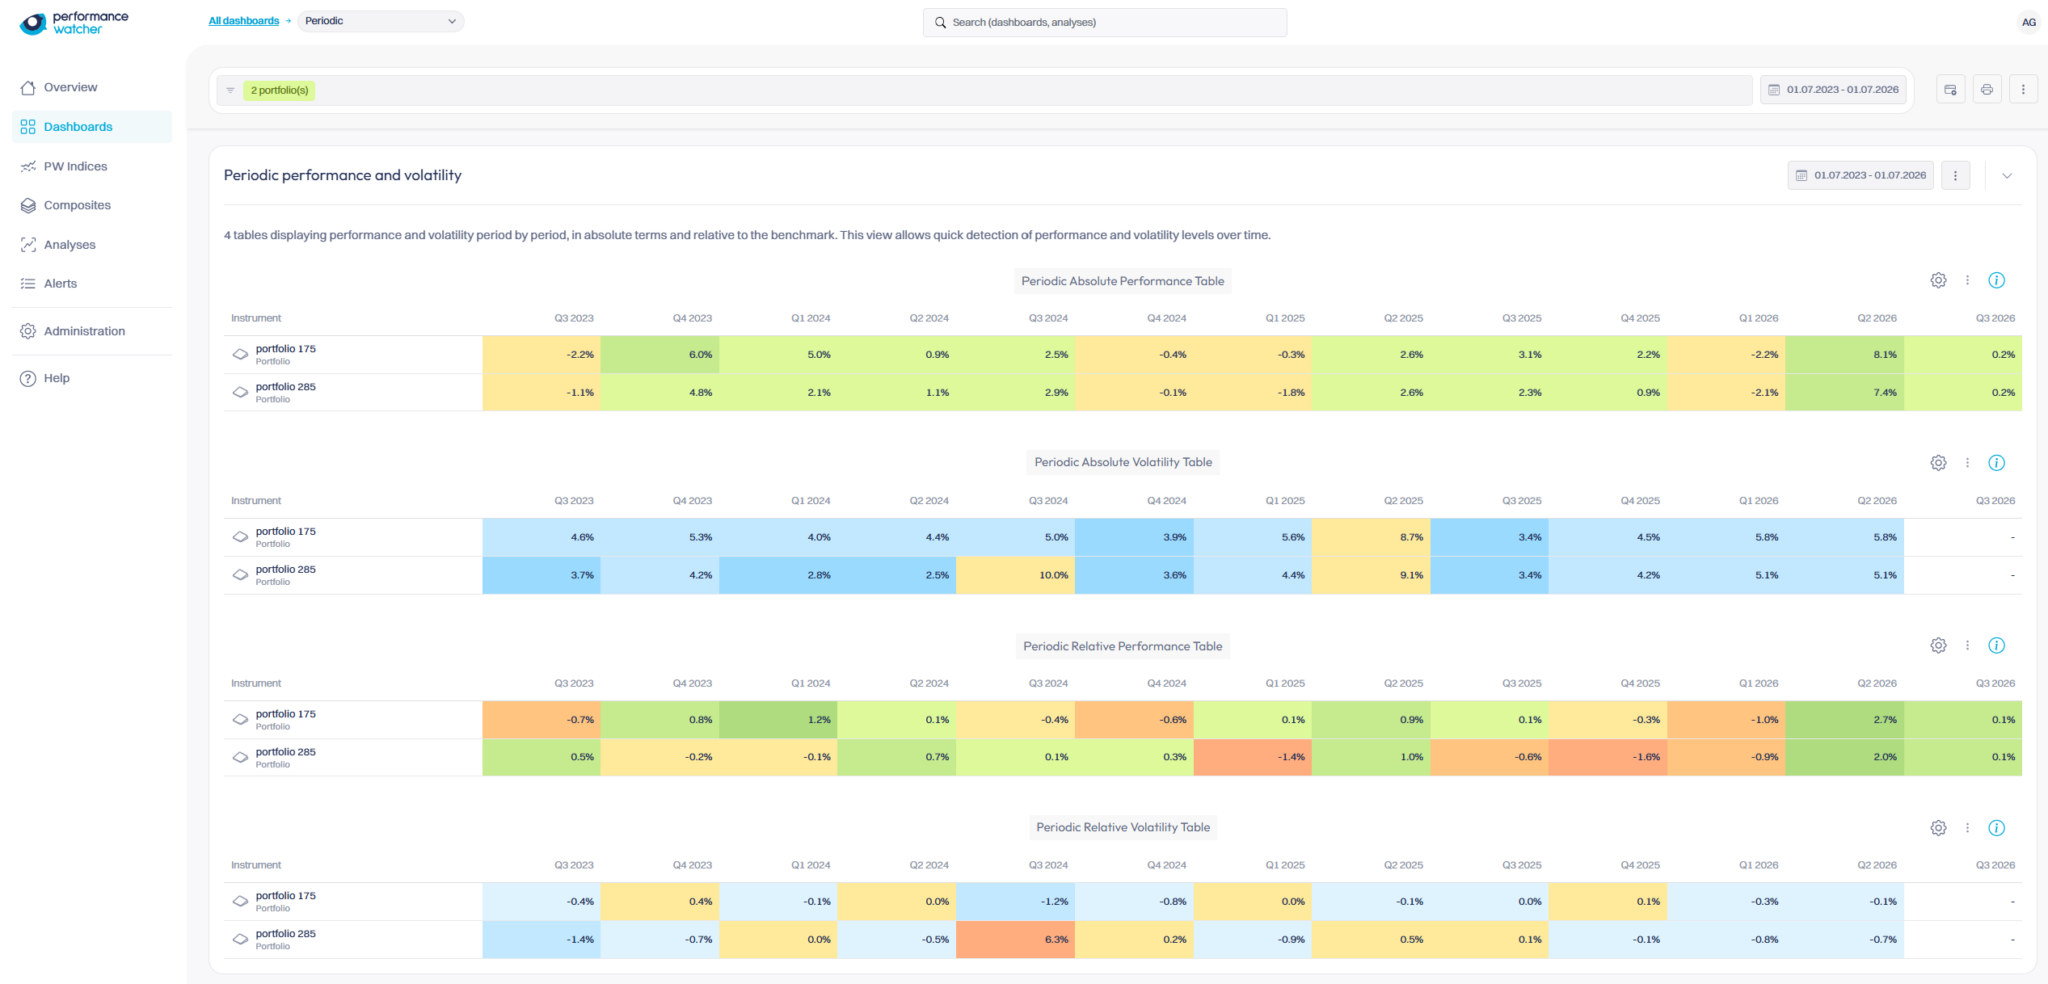
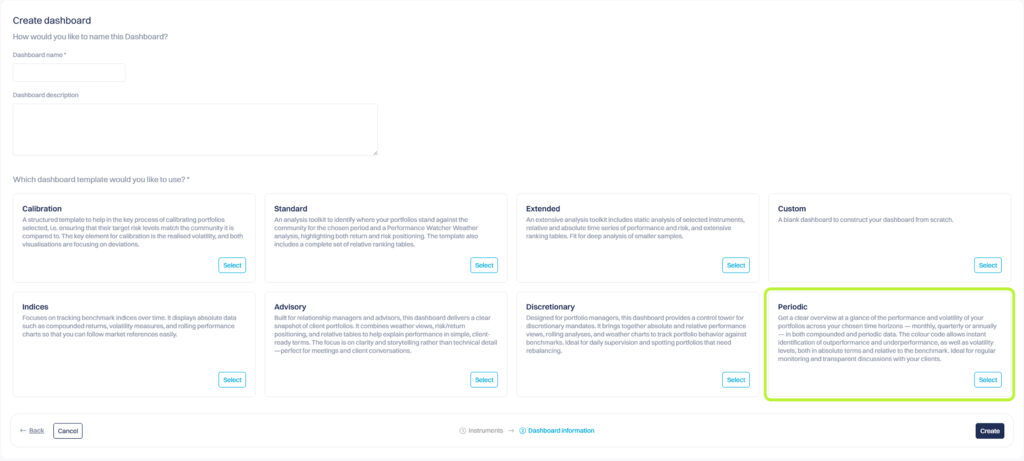
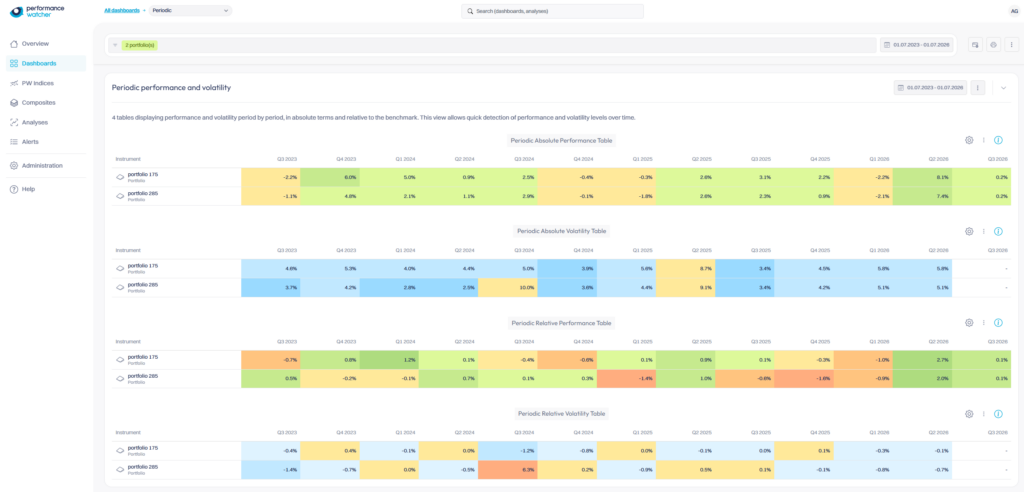
A new template is available when creating a dashboard: Periodic. It gives a clear view of your portfolios’ performance and volatility over the horizon you choose (months, quarters or years), in periodic and cumulative data. A colour code instantly flags outperformance, underperformance and volatility levels, ideal for regular monitoring and transparent conversations, internally and with your clients.
As always, your feedback helps us build the platform. If you notice a bug or have a suggestion, let us know.
Performance Watcher keeps evolving every week. Stay tuned for the next update.