PW indices performances PW Indices from 31.12.2022 to 28.05.2023
  • CHF - Low risk : 1.29%
  • CHF - Mid risk : 2.54%
  • CHF - High risk : 3.45%
  • EUR - Low risk : 1.94%
  • EUR - Mid risk : 3.33%
  • EUR - High risk : 4.12%
  • USD - Low risk : 2.44%
  • USD - Mid risk : 3.54%
  • USD - High risk : 4.59%
  • GBP - Low risk : 0.69%
  • GBP - Mid risk : 1.32%
  • GBP - High risk : 0.64%

Evaluate wealth management by comparison

Sign up

To provide everyone with transparency on the quality of the performance of the portfolios managed, in a secure, simple and relevant manner, and in total independence.

Performance Watcher is a participatory network that makes it easy to compare, track and communicate investment results.

Equity
more ›
Portfolio performance measurement available to all.
+
Trust
more ›
You share, we protect your data and provide you with reliable indices
+
Innovation
more ›
Innovating to help you progress
+
Independence
more ›
Independent to provide you with an objective measure

Who is Performance Watcher for?

Professionals who manage
  • Banks
  • Self-employed managers
  • Private clients
  • Family offices
Learn more
Professionals who delegate
  • Private clients
  • Trustees
  • Family offices
Learn more
Private investors
  • Employees
  • Retirees
  • Entrepreneurs
  • Rentiers
  • Self investors
Learn more
Financial consultants
  • Banking consultants
  • Retirement coaches
  • Compliance officers
Learn more
Banking application providers
  • Portfolio Management Systems (PMS)
  • Data aggregators
  • Banking systems
Learn more
Disseminators of financial information
  • Journalists
  • Bloggers
  • Influencers
Learn more

They have already joined the community

  • From 2014
  • From 2016
  • From 2016
  • From 2016
  • From 2016
  • From 2016

A powerful and intuitive solution for tracking performance and risk

Discover the solution

Test our perfometer

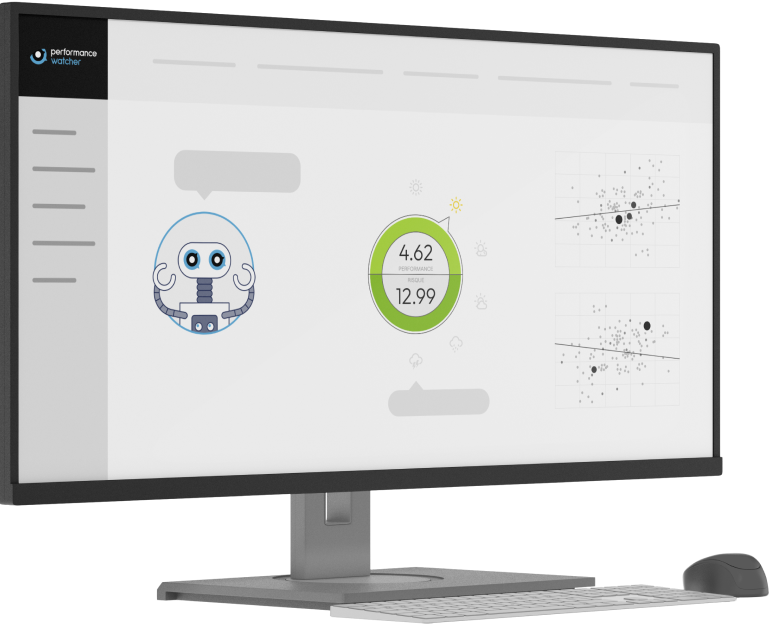
The Perfometer is the heart of Performance Watcher's analysis tools. Thanks to its simplicity and precision, it allows you to instantly compare the competitiveness of the portfolio under analysis. Without jargon, an explicit and simple-to-understand weather pictogram, gives you the information you need to make your assessment.

For example here, for the last three months, with three anonymised investment funds, very popular in Switzerland:

  • FUND 1 - CHF - Mid Risk
  • FUND 2 - CHF - Mid Risk
  • FUND 3 - CHF - Mid Risk
-0.30
5.38
0.18
4.82
1.75
5.96

Would you like to test with your own performance data?

Sign up

Key figures

23'922
portfolios
52.98 billions
of total assets in CHF
1'278
users

Benefits and added value

Transparency Factual, efficient, quantitative
Data processing Simple, anonymous, secure
Independence Neutral

In the press

See all articles
15.01.2023
Un client de la gestion de fortune suisse a perdu 15% en moyenne l’an dernier

Les performances observées sur les comptes gérés en Suisse ont varié entre -5% et -22%, selon un échantillon de 3000 comptes. Les gérants plus réactifs ou plus sophistiqués ont pu limiter les dégâts. Sébastien Ruche

Read the article See the PDF article
18.10.2022
Shining A Light On Risk, Returns With Performance Watcher

We talk to Performance Watcher by IBO, a Swiss organisation that uses an open-source model to collect and spread data to its network on how well, or not, investment portfolios perform when set against their agreed risk tolerances. It's a field of intense concern in today's volatile markets.

See the PDF article