PW indices performances PW Indices from 31.12.2023 to 31.08.2024
  • CHF - Low risk : 4.12%
  • CHF - Mid risk : 6.53%
  • CHF - High risk : 9.25%
  • EUR - Low risk : 4.40%
  • EUR - Mid risk : 6.31%
  • EUR - High risk : 7.94%
  • USD - Low risk : 5.82%
  • USD - Mid risk : 7.28%
  • USD - High risk : 9.00%
  • GBP - Low risk : 3.93%
  • GBP - Mid risk : 5.89%
  • GBP - High risk : 4.10%
You disseminate financial information
Journalists, Bloggers, Influencers...

Evaluate wealth management by comparison

To show performance and risk objectively and transparently, independently of the managers, and participate in the development of market transparency.

Join the community to...

Access to unique and neutral data

With several years of hindsight, unique and reliable aggregated data, and complete independence from financial actors, PW's performance serves as an objective basis for discussion.

Have an objective benchmark for performance comparison

It isn't easy to know what performance is generated by asset managers. We can objectify this data by offering transparency and analysis, objectifying this performance in a coherent context.

Introducing the vital notion of risk into the analysis

Performance means nothing without a risk context. We bring this dimension into all our analysis.

Objectivising the quality of the performance of managers and banks

The performance path and risk management are important dimensions in the analysis. Performance Watcher enables this analysis.

How it works

Performance Watcher is a participatory network that makes it easy to compare, track and communicate investment results.

01

Contact us to find out more about our mission

02

Accessing basic Performance Watcher data

03

Become a media partner

Contact us

A powerful and intuitive solution for tracking performance and risk

Discover the solution

Test our perfometer

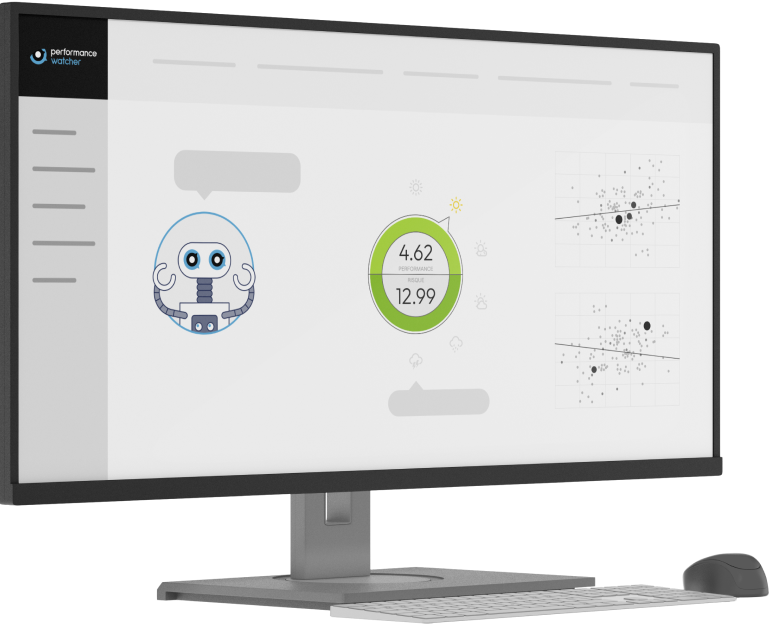
The Perfometer is the heart of Performance Watcher's analysis tools. Thanks to its simplicity and precision, it allows you to instantly compare the competitiveness of the portfolio under analysis. Without jargon, an explicit and simple-to-understand weather pictogram, gives you the information you need to make your assessment.

For example here, for the last three months, with three anonymised investment funds, very popular in Switzerland:

  • FUND 1 - CHF - Mid Risk
  • FUND 2 - CHF - Mid Risk
  • FUND 3 - CHF - Mid Risk
-0.30
8.51
2.05
8.08
0.67
11.34

Would you like to test with your own performance data?

Sign up